Tag: Visualization
-
P-adic wheels
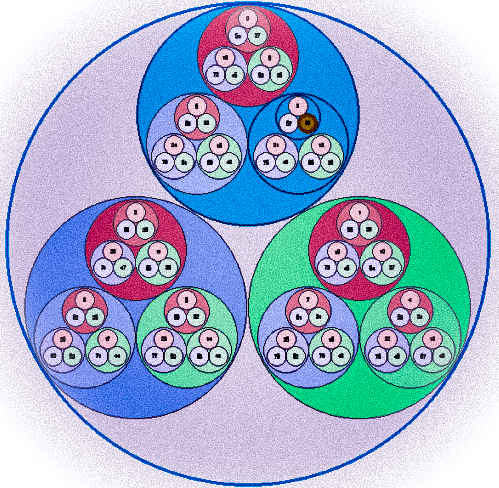
In the usual (real) number line, two numbers are “close” if their leading digits agree: is closer to than to . The p-adic world flips that intuition: closeness is governed by agreement of the low-order digits (divisibility by powers of a prime). This post introduces a small Pygame visualization (shown as circles inside circles inside…
-
Multiobjective Heatmaps: Landscape Visualization via ε-Dominance
Michael Emmerich, January 16th, 2025(inspired by a discussion of an application problem with Jonas Schwaab, ETH Zurich) In single-objective optimization, it is easy to visualize a function that depends on only two continuous or integer input variables by means of a heatmap plot, where the lightness indicates the achievement in the objective function, say F(x1,…
