Category: Scientific Visualization
-
A very, very simple method to estimate Pi
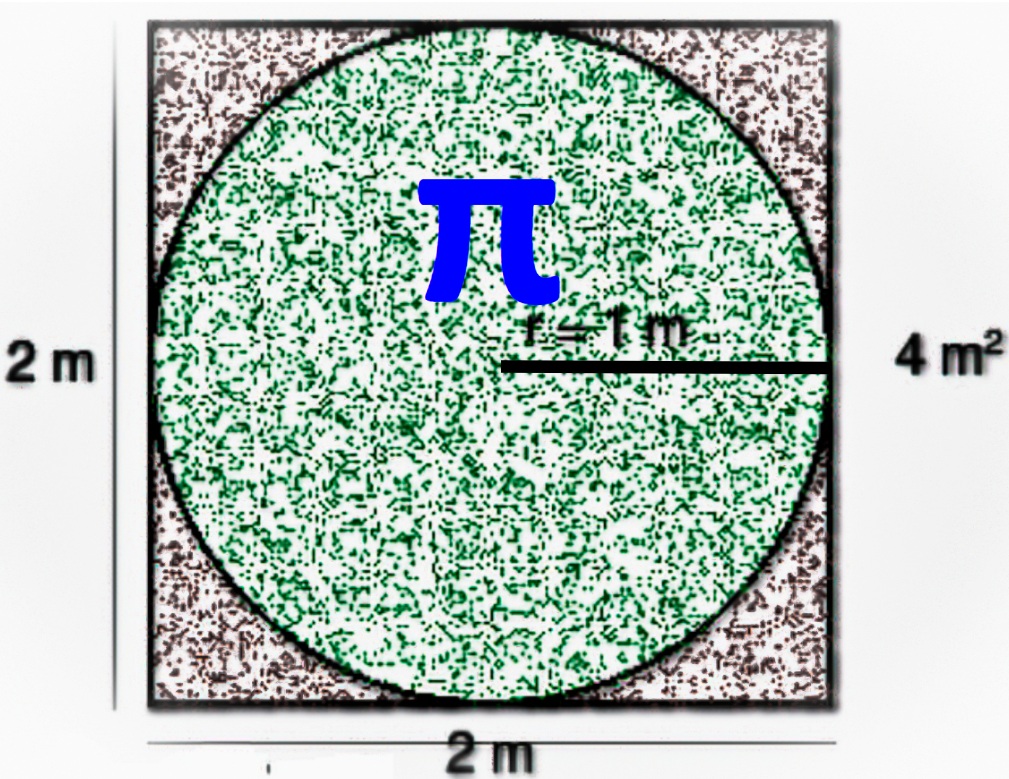
Date: 2026-03-15 Author: Michael T.M. Emmerich Every year, on March 14, mathematicians celebrate Pi Day. For my Mathematical Playground blog, I wished to post a short essay on a very, very simple Monte Carlo method for estimating . The nice aspect of this method is that it requires only a few lines of code, does…
-
Centroid Subdivision of a Triangle: A Simple Recursion Creating a Complex Pattern
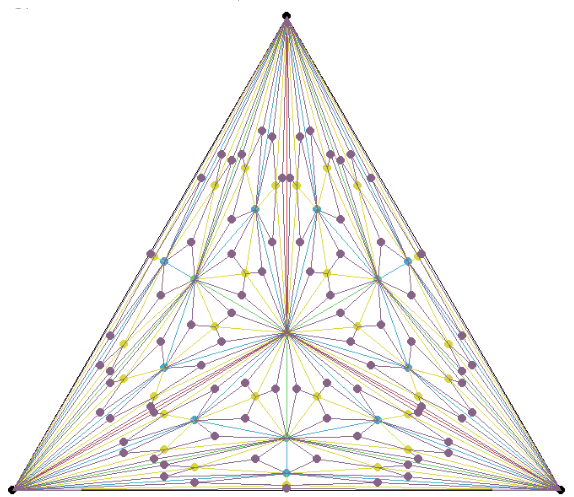
Michael Emmerich, 12 July 2025 1. Introduction A single, easily stated geometric rule—“draw the centroid of a triangle, connect it to the three vertices, and repeat recursively on the new sub-triangles”—produces a surprisingly intricate picture. This short exposition introduces the construction, shows how recursion drives the emergence of symmetry and complexity, and points out why…
-
Multiobjective Heatmaps: Landscape Visualization via ε-Dominance
Michael Emmerich, January 16th, 2025(inspired by a discussion of an application problem with Jonas Schwaab, ETH Zurich) In single-objective optimization, it is easy to visualize a function that depends on only two continuous or integer input variables by means of a heatmap plot, where the lightness indicates the achievement in the objective function, say F(x1,…
